Moving Average Indicator

Moving Average Forex
Moving Average Forex Strategy
Moving Average Indicator help traders determine the price direction of the market.
- Indicators and Their Purposes
- Moving Average
- Types of Moving Averages
- Trading with Moving Average
- Trading with one MA
- Trading with two MAs
- Trading with several indicators
Moving Average – Definition
This indicator helps determine the trend direction, its possible reversals, as well as a flat market (when the price is neither rising nor declining).
How is that achieved?
Moving Average (MA) is a trend indicator, which is essentially a curve calculated based on the price changes.
As such, the moving average assists traders by confirming the trend. On the chart, this curve mirrors the price direction, but its movements are smoother.
In the examples below, you will find helpful information abouthow this indicator determines the trend:
Determining uptrend with МА
Chart designations:
- Uptrend
- Maximums are constantly renewed
- SMA (red) reflects asset growth
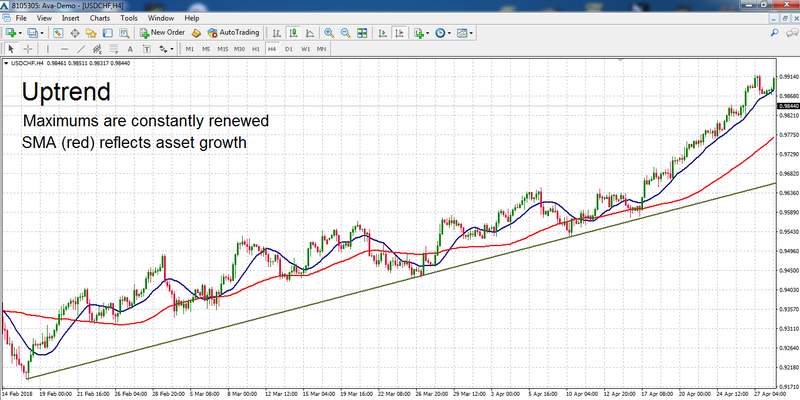
The first example demonstrates how the growing asset formed an uptrend and the Moving Average confirms it. A downtrend is shown in the next chart.
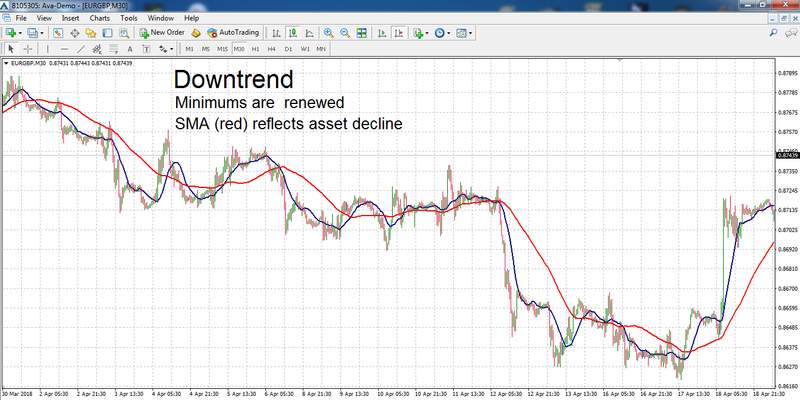
Determining downtrend with МА
Chart designations:
- Downtrend
- Minimums are renewed
- SMA (red) reflects asset decline
Moving Average: Indicator Characteristics
At each point, the MA value is an average price indicator over a certain period of time.
Sometimes it is an arithmetic mean, other times more complex formulas are employed.
A period is the main indicator’s parameter;t determines the number of time series to be factored in when setting the moving average parameter.
There four basic MA types:
- Simple MA – Its values are simple arithmetic means of the price changes.
- Exponential MA – Here more weight is given to the latest data. The weight is calculated in arithmetic series.
- Linearly weighted MA -More weight is given to the latest data, however, the weight is calculated exponentially.
- Smoothed MA – More weight is given to the latest data, it takes into account the price values beyond the time period (their influence is not significant).
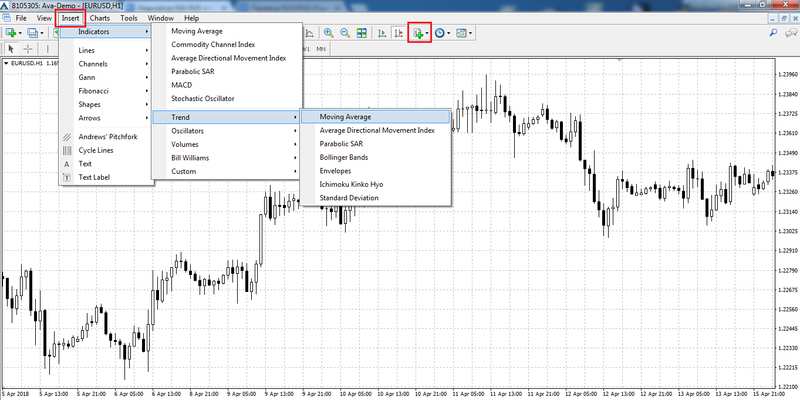
It is quite easy to add this indicator in the MetaTrader 4 chart. You can do that by selecting “Indicators” – ”Trend” – ”Moving Average” in the “Insert” tab of the upper menu or just by clicking on the relevant icon on the toolbar.
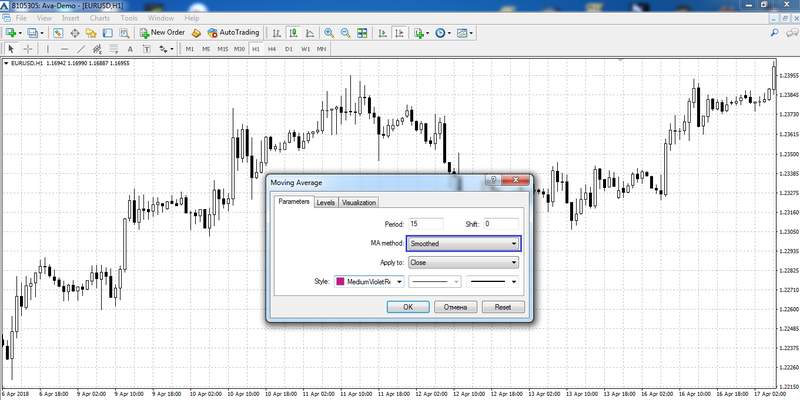
To set the indicator, right-click on the indicator and choose Parameters.
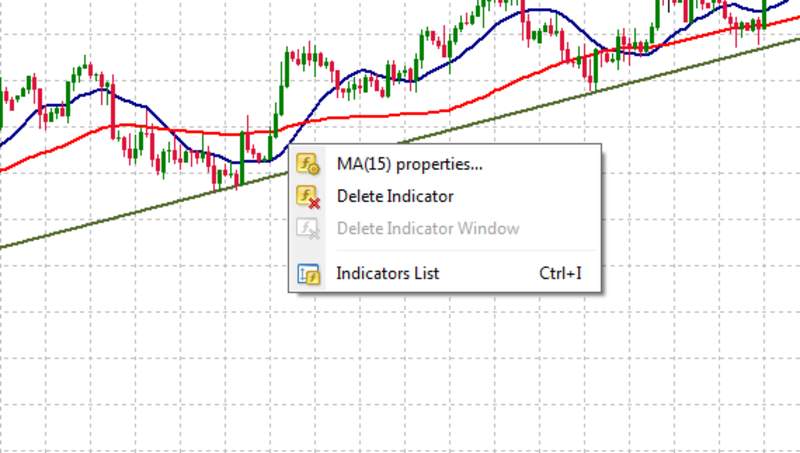
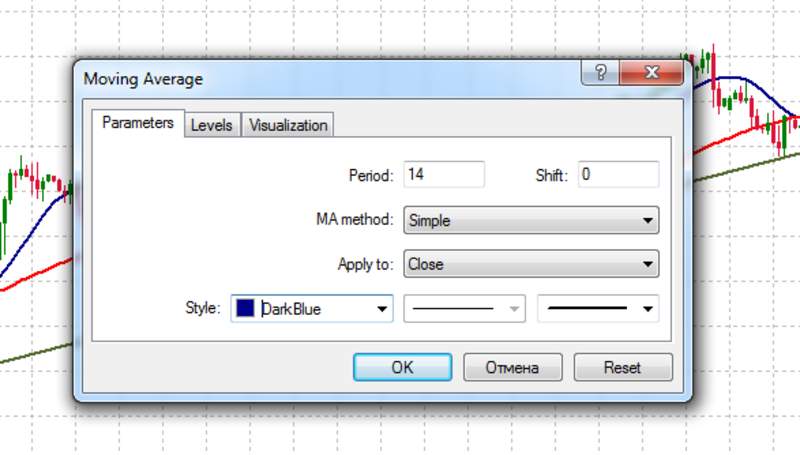
You will see a window, where you can set the following parameters:
- Period
- Shift
- МА method ( МА type, e.g. Simple or Smoothed)
- Apply to (calculate based on the opening/closing price, etc.)
- МА style (color, thickness)
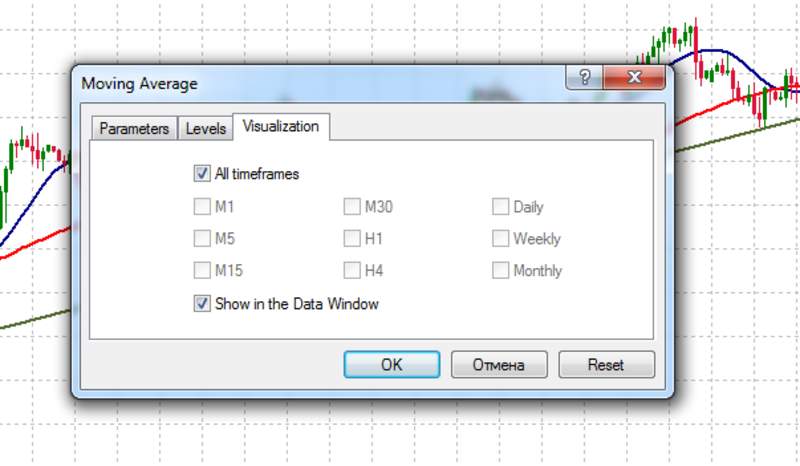
You can also choose the timeframes in the Parameters window. For example, if your trading strategy envisages only 14 МА on the H4 and H1 charts, you need to specify it in the settings:
The majority of strategies use Simple Moving Average. As a rule, it is set to default unless otherwise required by the trading system.
Moving Average Types
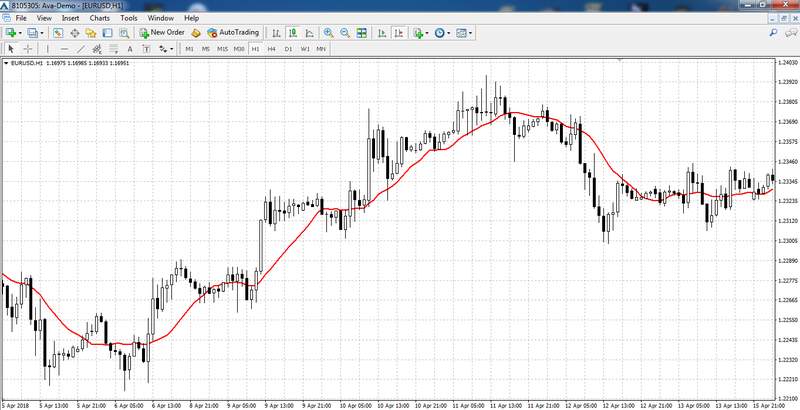
Simple moving average (SMA)
Simple Moving Average is represented as a line and is calculated based on the arithmetic means of the previous price values.
The bigger the period (the number of values taken into account), the smoother and more remote from the price chart, the moving average will be.
For example, if daily closing prices on a 5-day chart were at 1.2, 1.3, 1.2, 1.5, and 1.6, the SMA value at the next point will be 1.36. To obtain the next 5-day SMA value, we need to drop 1.2 and add the closing price that goes after 1.6 to the formula.
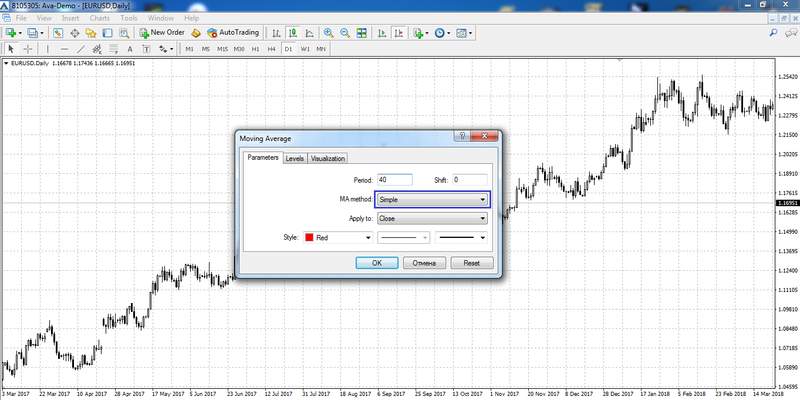
To add SMA on the chart, you need to choose the Moving Average from the general list of the platform’s indicators.
After that, you will see a window, where you will need to select Simple in the MA Method. Other settings depend on the trading strategy conditions.
SMA is the most popular MA type, and it lies at the core of many strategies.
Despite the fact that SMA is rarely used without additional indicators, there are some strategies that employ only SMA.
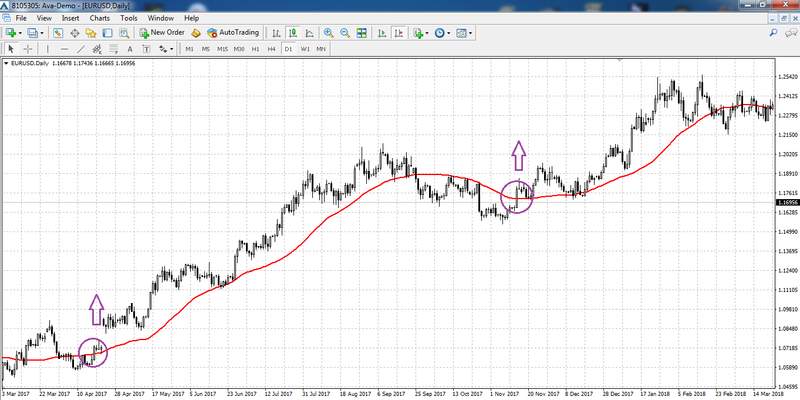
One of the most reliable SMA strategies is the “Sweet Chariot” strategy.
The Sweet Chariot strategy is designed for medium- and short-term trading, the optimum timeframes are D1 or W1.
Trading with 1-hour or 4-hour charts is also possible, however, the bigger the time frames, the more precise the trend will be.
And trading with the trend is the key to success with this strategy.
The signal indicator is 40-period SMA.
The strategy has two rules:
- If the price crosses MA upwards and the candle is closed above the moving average, you need to buy when the next bar opens.
- If the price crosses MA downwards and the candle is closed below the line, you need to sell.
Stop loss is set below the minimum (or above the maximum) of the low candle.
The profit can be locked using both take profit (for example, its distance can be three times (or more) larger than the stop loss value) or trailing stop.
The Sweet Chariot is quite an old strategy. Despite the fact that the traditional version does not use any oscillators, some traders can add other tools like ADX.
The Chariot works really well with the trend. However, it is only logical to use a filter to minimize the risks of entering the flat market.
Exponential Moving Average
Exponential МА is different from the simple one in that it gives more weight to the latest data when calculating the MA value at each point.
The EMA formula is rather complex, but, essentially, it means that a 10-period EMA will give the most weight to the previous price values and the closing price of the 10th candle (in reverse order) will have almost no effect.
This MA has been developed to facilitate a smoother transition between the time frames.
Reduction in the weight of price values as they move away resolves the SMA’s problems, where dropping the last price can affect the indicator more than adding the new one.
As a result, a line with the same period is smoother and closer to the chart, and its signals are less dependent on the large but outdated values.
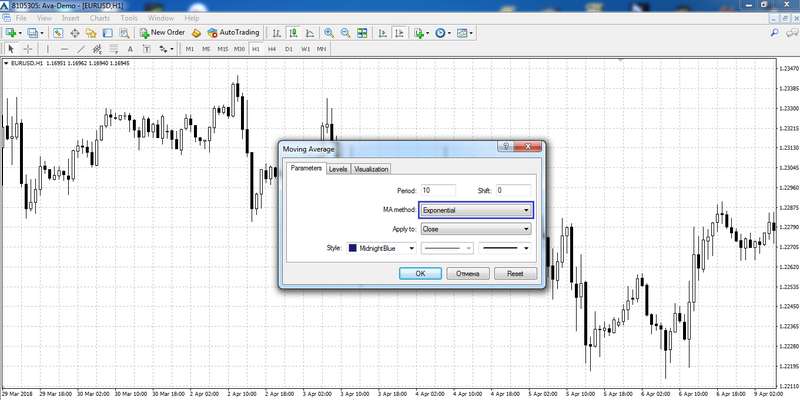
EMA is set in the same way as SMA. The only difference is that you will need to choose Exponential as the MA Method in the indicator window.
Many of the Forex trading strategies that use SMA can employ EMA as well.
When refining traditional strategies, professional traders can sometimes change not only the period but also MA type by substituting SMA with EMA.
After testing and revising, this modification can prove more profitable and effective than the traditional SMA system.
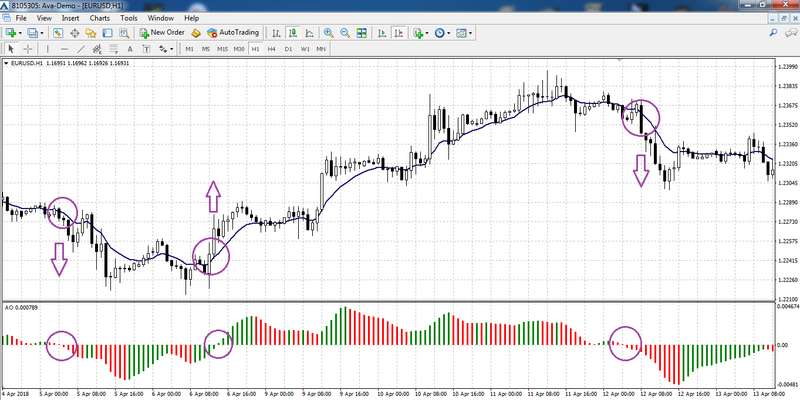
The EMA+ Awesome Oscillator strategy could be a good example.
It is a well-known combination of a trend indicator, which determines the trend direction, and the oscillator that helps in choosing the best moment to enter the market.
This strategy is suitable for any time frame, but we recommend it for short-term trading with M15-H1 charts.
A long position is open in the following cases:
- The price crosses EMA upwards.
- The AO histogram crosses the zero line upwards.
Conversely, a short position is open.
The system is quite simple and does not involve any strict requirements for exiting the market.
The position can remain open until the reverse signal is received or you can set stop loss and take profit parameters.
If you’ve chosen the latter option, the loss/profit ratio shall be no less than 1:3.
Linearly weighted moving average
This MA type, just like EMA, gives more weight to the latest price data. However, with WMA the weight is calculated in geometric and not arithmetic series.
For example, for a 5-period MA the weight of the last price value will be 5, the one before that will be 4 and so on until it reaches 1.
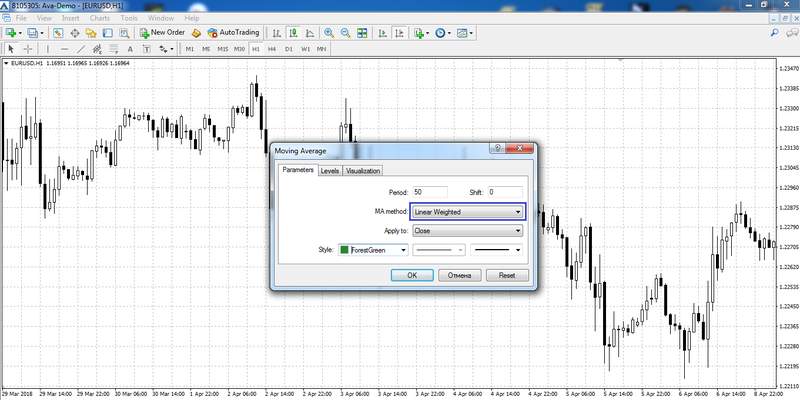
The WMA is set in the same way as the previous ones. The only difference is that you will need to choose Linear Weighted as the MA Method in the indicator window.
There are not that many trading strategies that use WMA.
Usually, these are advanced strategies that have been developed by experimenting with and modifying more simple systems.
For the sake of example, let us have a look at the strategy that employs WMA, RSI and MACD.
It is designed for medium-term trading with a day chart, EUR/USD would be the optimum asset.
Firstly, you need to add the following indicators to the chart:
- Five WMAs with the periods of 5, 15, 30, 60, 90.
- RSI oscillator, period is 5, levels are 40 and 60.
- MACD with periods of 5 and 13 for slow and fast EMAs, correspondingly (SMA is default).
A short position is open in the following cases:
- The fastest 5-period WMA crosses the 15-period MA and they are both below the remaining MA.
- The RSI line is in overbought (above 60) and crosses this level downwards.
- The MACD histogram rises above 0.005 and then crosses it in reverse.
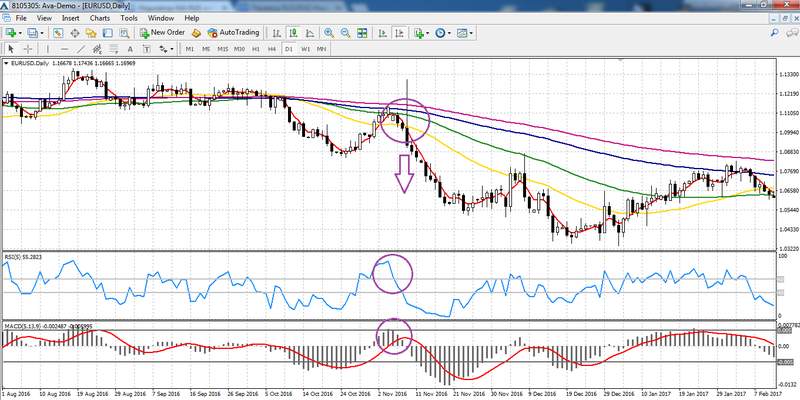
Conversely, a long position is open.
This strategy was developed by traders from the West several years ago, and it was praised on the forums.
Nevertheless, some specialists think that three WMAs (30, 60 and 90 periods) are superfluous and could be removed without affecting the quality of the forex signals.
Traders are free to decide on how to exit the market, however, stop loss is mandatory according to all the risk management rules.
A protection order can be set both at the low candle’s minimum/maximum or the closest support/resistance level.
Smoothed MA
This type of MA takes into account not only the price values within the set period but also some historical data.
Although the priority is given to the weight of the more recent data, the historical values also affect the final results.
If EMA and WMA move more smoothly and are closer to the price chart than the SMA with the same period, then smoothed moving average will be remote.
Smoothed moving average is set in the same way as all the previous ones: traders choose the period, shift and style and then select Smoothed as the MA Method.
Smoothed Moving Average is the least popular MA type.
It is rarely used in any trading strategies and mainly employed in complex automated trading systems or as part of custom indicators.
Trading with MA
Moving Average is a universal tool. It is suitable for any timeframes and assets.
There are plenty of different trading strategies and approaches that use moving averages. Below are the most basic ones.
Trading with one MA
This is the most basic and universal approach. Since only one indicator is needed for the analysis, the position should be open when the price crosses the MA:
- If the price crosses MA upwards, a long position opens.
- If the price crosses MA downwards, it’s best to sell.
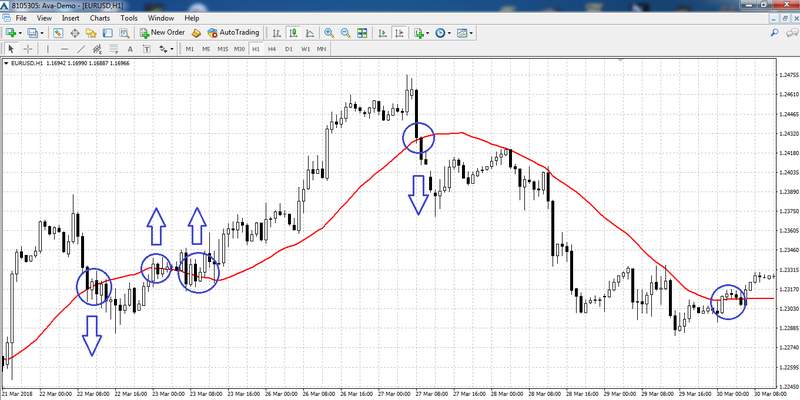
One of the strategy’s shortcomings is that there are many false signals. One MA can help catch a major trend, but before that, you might have to open several losing positions.
That is why you have to set stop loss for each position and allow the profit to grow, thus compensating for the previous losses.
Trading with two moving averages
This approach is similar to the previous one, but here the chart has two MAs with different parameters. The signal will be the intersection of the two MAs:
- If the fast MA crosses the slow one upwards, a long position is open.
- Conversely, it’s best to sell.
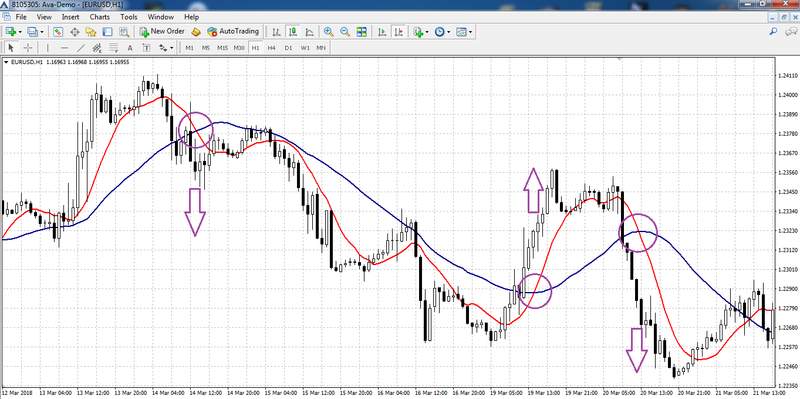
As becomes clear from the example, the second MA allows to filter out many false signals.
Then again, there is another problem which is connected with lagging. It often happens that the two MAs intersect only when half of the trend is already behind.
Moving Average + MACD
MACD is an oscillator that uses the data on two MAs and their interactions. Together with MA, it acts as a filter.
The MA+MACD strategy algorithm is as follows:
- It is recommended to go long when the price crosses MA upwards and the MACD bars cross the line upwards as well.
- It is best to go short when the price crosses MA downwards, and the MACD bars move in the same direction.
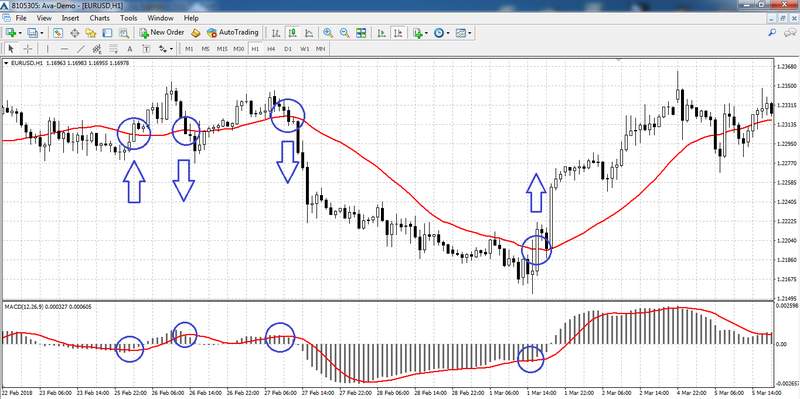
If the signal of one of the indicators is lagging and they are not synchronised, it’s best not to open a position.
Conclusion
Moving Average is a universal indicator that is used for trading chart analysis in all financial markets.
The technical analysis specialists use moving averages to trade not only Forex trading pairs; they also use them with CFDs, commodities trading futures and even in bitcoin trading.
Basic MA trading strategies will help you gain experience and master your skills.
Apart from that, you will have to learn more about other indicators and try to use them to make your trading more effective.
However, the only way to get truly substantial profits is to develop your own strategy based on your trading experience.
The strategies described in this article are available on the AvaTrade’s trading platform.
< style=”text-align: center;”>You can test them without any risks as each new trader gets a free demo account that they can use for 21 days.
Main Moving Average Forex Strategy FAQ
- What are the best moving averages to use for forex?
Because moving averages are the most commonly used indicator in forex trading it’s quite likely that anyone looking to trade forex will use moving averages at some time. But which are the best moving averages to use in forex trading? The depends on whether the trader has a short-term horizon or a long-term horizon. For short-term trades the 5, 10, and 20 period moving averages are best, while longer-term trading makes best use of the 50, 100, and 200 period moving averages.
- What are moving average trading strategies in forex?
Moving average crossover strategies have been found to be quite useful, but traders need to choose the proper moving averages for their trading strategy. A simple moving average typically lags price by too much to be useful in trading. Instead an exponential moving average should be used. Even better for moving average trading strategies is the use of the double exponential moving average (DEMA). Because the DEMA puts a far greater emphasis on the most recent prices its changes reflect price movements more rapidly. Many traders like to use a crossover strategy with DEMA tools, where a fast moving average such as the 10 period, crosses a slower moving average such as the 50 period.
- What is the best moving average crossover combination?
The best moving average crossover combination depends on the time horizon of the trader, as well as the market being traded. A short time horizon calls for a moving average crossover strategy that uses shorter moving averages, such as the 5 period and 20 period. A longer time horizon might see a trader using a crossover strategy that combines the 50 period and 200 period moving averages. Using both combinations together can yield the best strategy. The trader uses the long time horizon to determine the longer-term trend, and then only trades in that direction using signals generated by the shorter-term strategy.


