- Trading
- Markets
- Platforms & Tools
- About
Analyse price action and chart patterns to uncover new opportunities. AvaTrade equips you with technical analysis tools to help you understand market movements and refine your strategy.
Technical analysis in CFD and Forex trading refers to the study of historical data and charts, in order for traders to make better-educated trades. It also represents the basis for various automated trading solutions, like the trading bots. Please note, past performance is not always a reliable guide to future performance.
There are 3 basic types of trends:
First, one must decide the type of trader/investor that they are. You must decide whether or not you hold positions for a long time or buy and sell fast. That decision will determine which trading charts you should be using. Day traders or those who jump in and out of positions fast, so they will use daily and intraday charts more than investors who buy and hold for longer period of times.
A support level could be the previous low. The resistance level could be the previous day’s high point, or better known as a peak. After a resistance level has been broken, it will usually become a support level should the instrument you are trading decline again. When the instrument moves down and breaks the support, then this becomes the new low. Looking at it the other way, if the instrument moves higher through the resistance level, this becomes the new high.
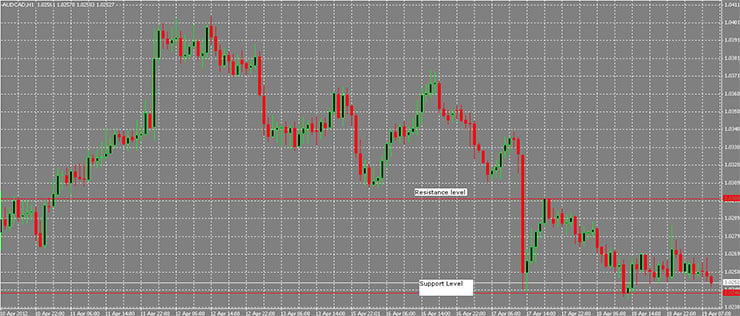
Check out the complete Support and Resistance trading strategy guide.
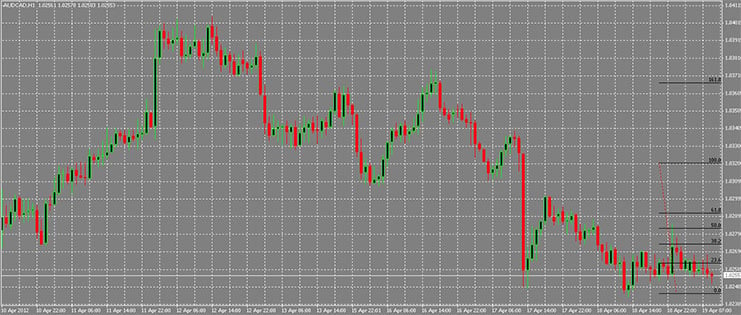
Retracements are percentages. During any given day (open to markets), the instrument you are watching or investing in, will usually retrace previous day’s trades. No matter if they are up or down. The most commonly used is fifty per cent. We also use one third, 38% and 2/3 levels.
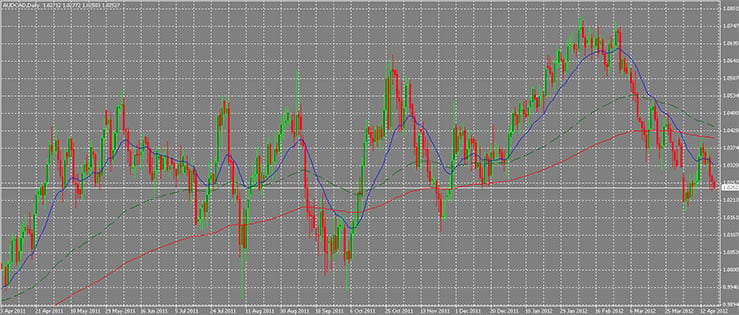
The easiest way to begin your analysis is by learning and applying trend lines. The first thing you must do is to draw a straight line that joins two points on your chart. To show a trend line that is increasing, connect two lows in a row and for a trend line that is decreasing, connect two straight peaks. You will note that usually, the market (price) will pull back towards a trend line before resuming a trend. When the price breaks a trend line, this is the end of a trend. The longer a trend line is, the more it has been tested and the more important it is. Note that a trend line becomes valid when the market touches it 3 times.
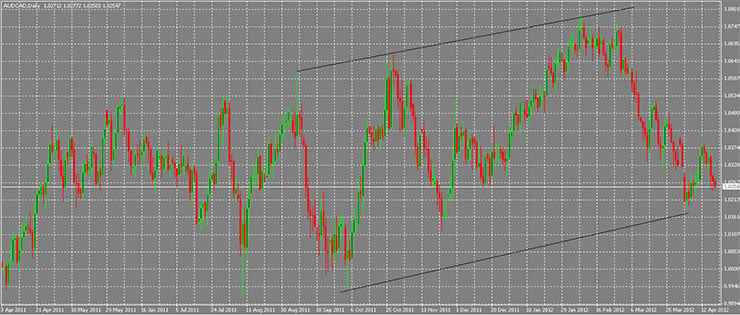
Learn how to effectively identify and follow trends in the markets with our comprehensive guide.
When you are looking for buy and sell signals, you look at moving averages. These averages will tell you if an existing trend is still in play. Beware: these do not predict trend changes, known as reversals. Traders usually use two moving averages. Movements above and below the 20 and 40-day averages are very popular. 5 and 20-day averages are very popular for those who trade quickly.
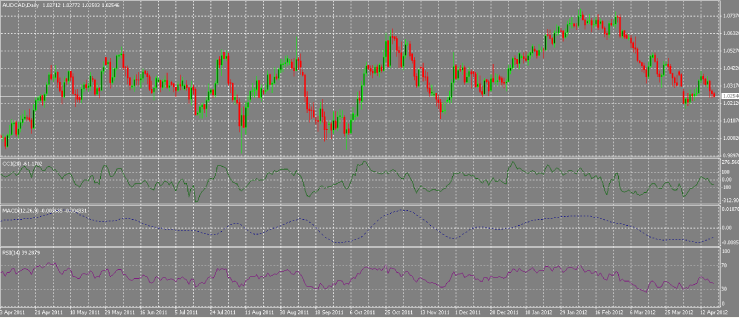
In order to identify overbought or oversold conditions in markets, oscillators are commonly used. These often warn a trader that a market has either risen or the market has fallen too far and a change is imminent. The Relative Strength Index or RSI and the Stochastics are the most popular oscillators a trader will use. These scales are from 0 to 100. The RSI: if the scale is over 70, this means it is overbought. If the scale is below 30, it is oversold. For Stochastics, the overbought level is 80, and the oversold level is 20.
Does technical analysis really work?
Some people claim that there is no real relationship between the past movement of prices and the future movement of prices, making technical analysis invalid. However, it is easy to see that there are patterns in prices that can be used to predict market movements via technical analysis. There are several theories as to why this is true. One is that chart patterns display the action inherent in an auction market and thus provides predictive value. Another is that orders cluster around psychologically important levels. And some theorize that technical analysis is a form of self-fulfilment in that because many traders believe prices should reverse or continue at certain levels, they do.
What are the most important indicators in technical analysis?
This is going to depend in many ways on your trading style or strategy. A swing trader is likely to use different indicators compared with a scalper. Some analysts claim support and resistance are the most important levels since they are present as part of almost every technical indicator. Support levels and resistance levels become more “important” when they are confirmed by two or more different indicators, and using multiple indicators can provide very powerful trading strategies.
What is divergence in technical trading?
A divergence is when two indicators are not moving in the same direction even though they would usually be expected to do so. While this might create confusion, divergences are often indicators of a significant turning point in the market. For example, an oscillator may indicate weakness in the market even though price continues going higher. Divergence should be traded cautiously however since it can last for a long time and doesn’t typically provide timely signals for trading.