

Pivot Points Trading Strategy
Trading Indicators • 13 min
Moving Average Indicator help traders determine the price direction of the market.
This indicator helps determine the trend direction, its possible reversals, as well as a flat market (when the price is neither rising nor declining).
How is that achieved?
Moving Average (MA) is a trend indicator, which is essentially a curve calculated based on the price changes. As such, the moving average assists traders by confirming the trend. On the chart, this curve mirrors the price direction, but its movements are smoother. In the examples below, you will find helpful information abouthow this indicator determines the trend:
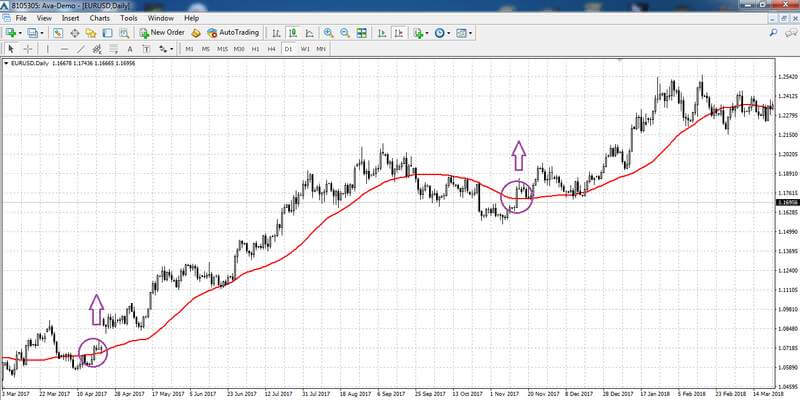
Determining uptrend with МА
Chart designations:
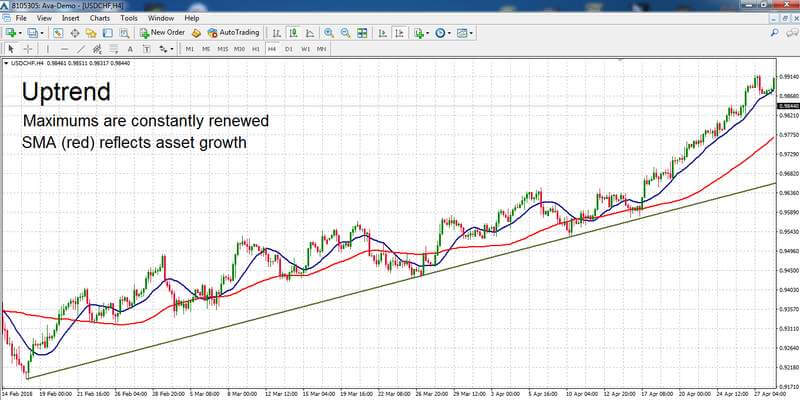
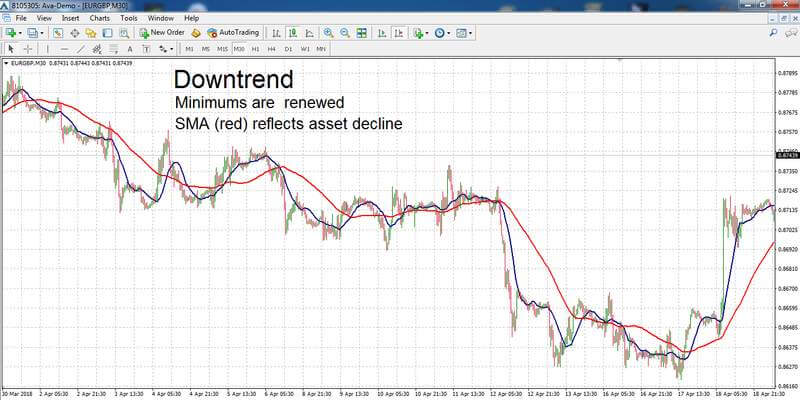
The first example demonstrates how the growing asset formed an uptrend and the Moving Average confirms it. A downtrend is shown in the next chart.
Determining downtrend with МА
Chart designations:
At each point, the MA value is an average price indicator over a certain period of time. Sometimes it is an arithmetic mean, other times more complex formulas are employed. A period is the main indicator’s parameter;t determines the number of time series to be factored in when setting the moving average parameter.
There four basic MA types:
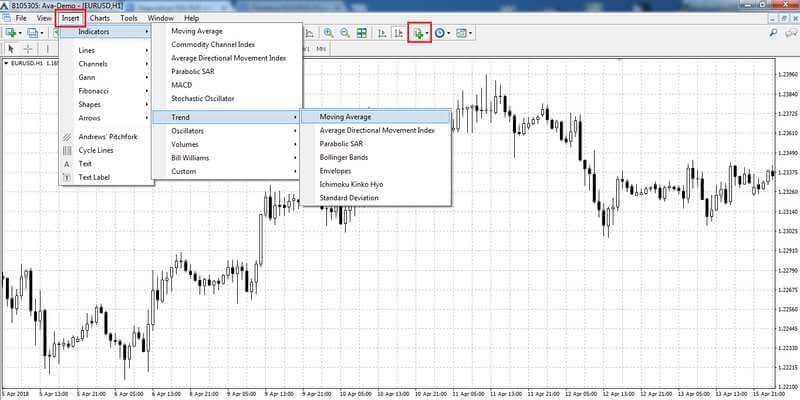
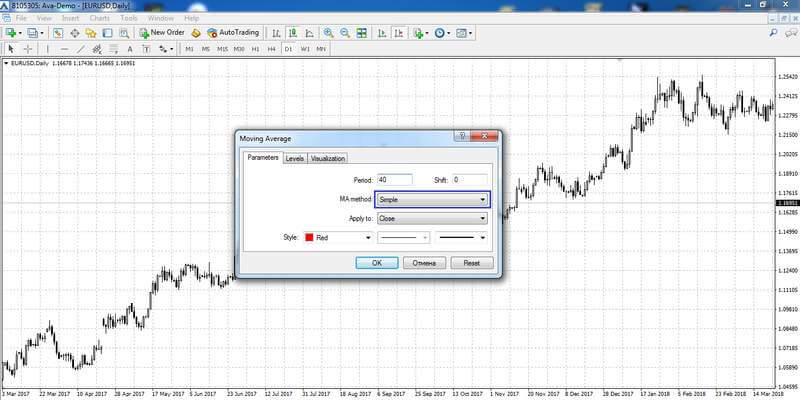
It is quite easy to add this indicator in the MetaTrader 4 chart. You can do that by selecting “Indicators” – ”Trend” – ”Moving Average” in the “Insert” tab of the upper menu or just by clicking on the relevant icon on the toolbar.
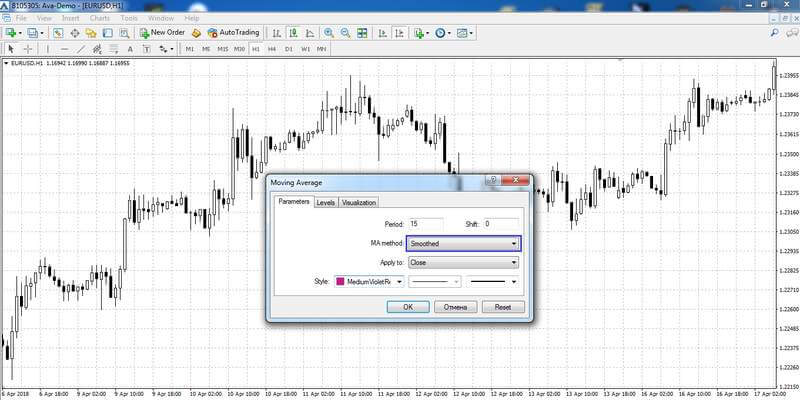
To set the indicator, right-click on the indicator and choose Parameters.
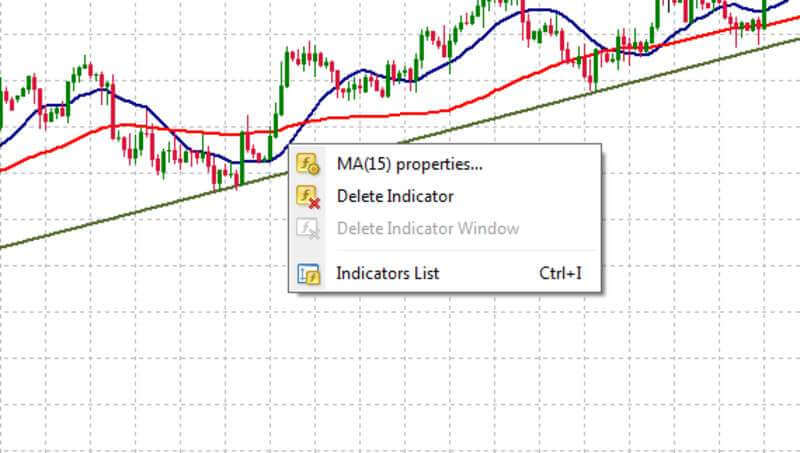
You will see a window, where you can set the following parameters:
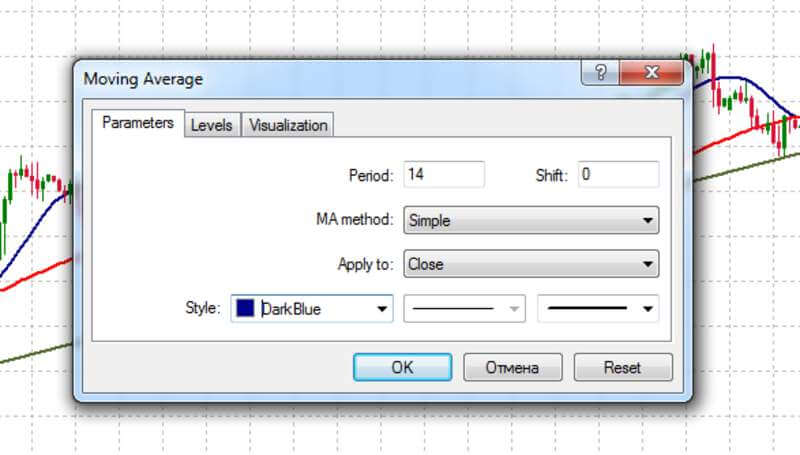
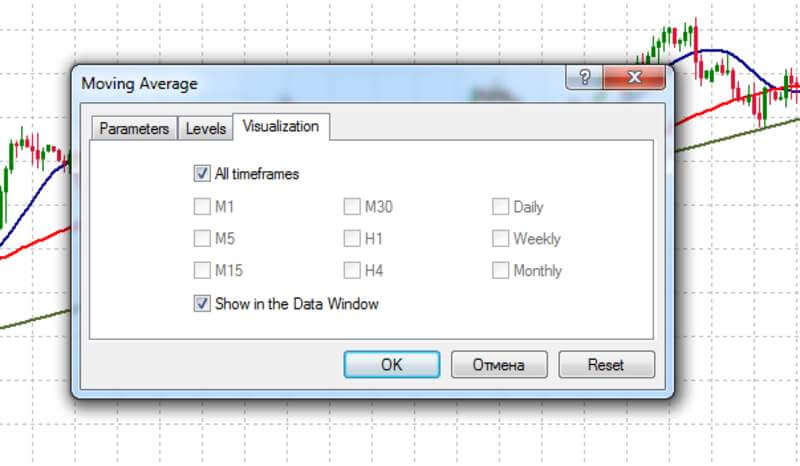
You can also choose the timeframes in the Parameters window. For example, if your trading strategy envisages only 14 МА on the H4 and H1 charts, you need to specify it in the settings:
The majority of strategies use Simple Moving Average. As a rule, it is set to default unless otherwise required by the trading system. Below we will have a closer look at the MA types and strategies.
A Simple Moving Average (SMA) is a line on a price chart, calculated by averaging the closing prices over a specific period. The longer the period, the smoother and further the SMA is from the actual price chart.
Example: if the last 5 days’ closing prices were 1.2, 1.3, 1.2, 1.5, and 1.6, the 5-day SMA would be 1.36. To calculate the next SMA value, drop the first price (1.2) and add the latest closing price to the calculation.
The SMA is one of the most widely used moving averages and forms the foundation of many trading strategies. While traders often combine SMA with other indicators, some strategies use SMA alone, such as the “Sweet Chariot” strategy.
This strategy is ideal for medium- and short-term trading. It works best on daily (D1) or weekly (W1) charts. It can also be applied to shorter timeframes like 1-hour or 4-hour charts, but larger timeframes provide more reliable signals.
Key Rules:
Risk Management:
While the traditional Sweet Chariot strategy doesn’t include extra tools, some traders add indicators like the ADX to reduce the risk of entering sideways (flat) markets. This strategy works best when a market is trending.
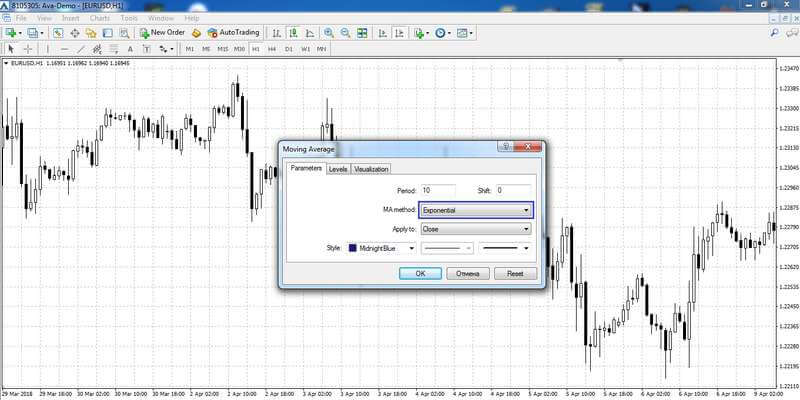
An Exponential Moving Average (EMA) is similar to a Simple Moving Average (SMA) but gives more importance to recent price data. This makes the EMA more responsive to current market movements.
Example: In a 10-period EMA, the most recent prices carry the most weight, while older prices (like the 10th candle in reverse order) have little impact. Unlike the SMA, the EMA’s formula reduces the effect of older, less relevant data. This creates a line that is closer to the price chart and less influenced by outdated values.
You can add EMA to your chart just like SMA, but when selecting the method, choose “Exponential” in your platform’s indicator settings. Many Forex strategies that use SMA can also use EMA. In fact, many professional traders often tweak strategies by replacing SMA with EMA and testing the results. EMAs are more suitable for short-term strategies that lay more emphasis on recent prices, whereas SMAs are ideal for long-term trading strategies.
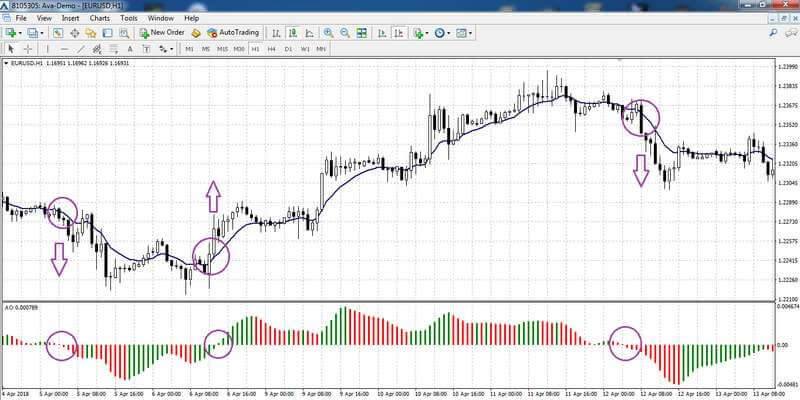
One example is the EMA + Awesome Oscillator strategy, which combines a trend indicator (EMA) with an oscillator (Awesome Oscillator, or AO) to pinpoint optimal market entry points.
This strategy works on any timeframe but is especially useful for short-term trading (M15 to H1 charts).
Key Rules:
Risk Management:
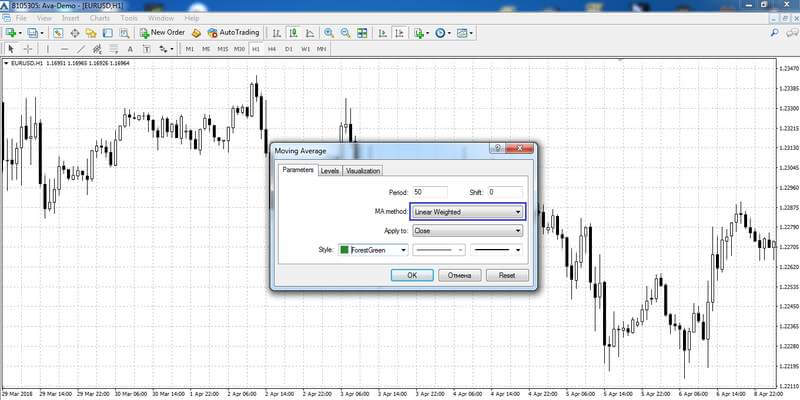
The Linearly Weighted Moving Average (WMA) is another type of moving average that, like the Exponential Moving Average (EMA), gives more importance to recent price data. However, WMA uses a geometric progression in its weighting system.
Example: In a 5-period WMA, the latest price gets a weight of 5, the second-most recent gets 4, and so on until the oldest value gets a weight of 1. This method makes the WMA highly responsive to recent price changes. You can add a WMA to your chart just like SMA and EMA but select “Linear Weighted” as the MA method in your platform’s settings.
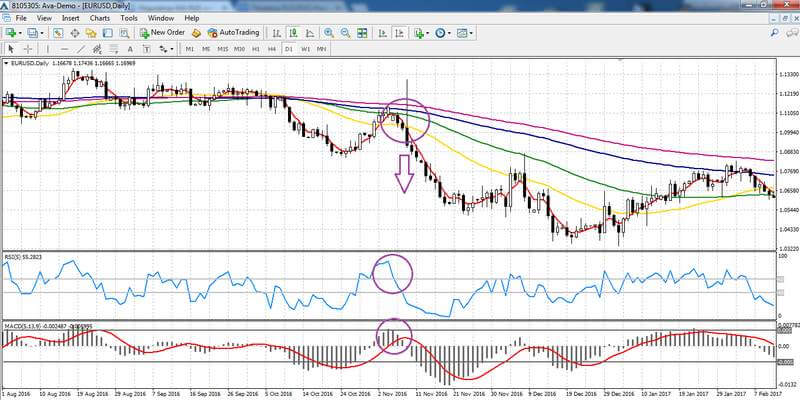
While WMA is less commonly used than SMA or EMA, it is a key component of some advanced trading strategies. One example is a strategy that combines WMA with the RSI (Relative Strength Index) and MACD (Moving Average Convergence Divergence) indicators. This strategy is ideal for medium-term trading on daily charts, particularly with the EUR/USD pair.
Indicators Needed:
Key Rules:
Risk Management:
Place the stop loss at the candle’s recent high/low or the nearest support/resistance level.
The Smoothed Moving Average (SMMA) differs from other moving averages by including both recent price data and historical price data in its calculation. While recent data has more weight, historical data still influences the results. This makes the SMMA less responsive to current price changes and positions it further from the price chart compared to the SMA, EMA, or WMA within the same period.
The SMMA calculation considers a broad range of data points and is designed to ‘smooth’ out recent price fluctuations and unimportant spikes/dips. The result is a clear line that is less volatile and provides a big picture of the long-term trend. It is therefore suitable for long-term trading strategies.
You can add an SMMA to your chart like any other moving average. Select the period, shift, and style, then choose “Smoothed” as the MA method in your platform’s settings. The SMMA is the least commonly used type of moving average. It is rarely applied in manual trading strategies but is occasionally used in advanced automated systems or custom indicators.
This type of MA takes into account not only the price values within the set period but also some historical data.
Although the priority is given to the weight of the more recent data, the historical values also affect the final results. If EMA and WMA move more smoothly and are closer to the price chart than the SMA with the same period, then smoothed moving average will be remote. Smoothed moving average is set in the same way as all the previous ones: traders choose the period, shift and style and then select Smoothed as the MA Method.
Moving Average is a universal tool. It is suitable for any timeframes and assets. There are plenty of different trading strategies and approaches that use moving averages. Below are the most basic ones.
This is the most basic and universal approach. Since only one indicator is needed for the analysis, the position should be open when the price crosses the MA:
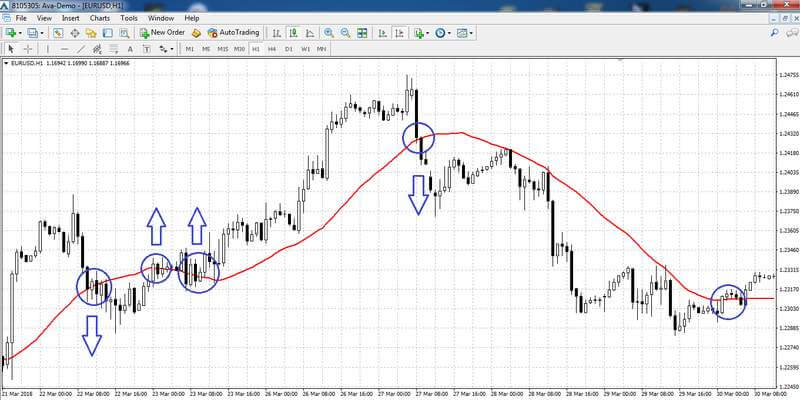
One of the strategy’s shortcomings is that there are many false signals. One MA can help catch a major trend, but before that, you might have to open several losing positions. That is why you have to set stop loss for each position and allow the profit to grow, thus compensating for the previous losses.
This approach is similar to the previous one, but here the chart has two MAs with different parameters. The signal will be the intersection of the two MAs:
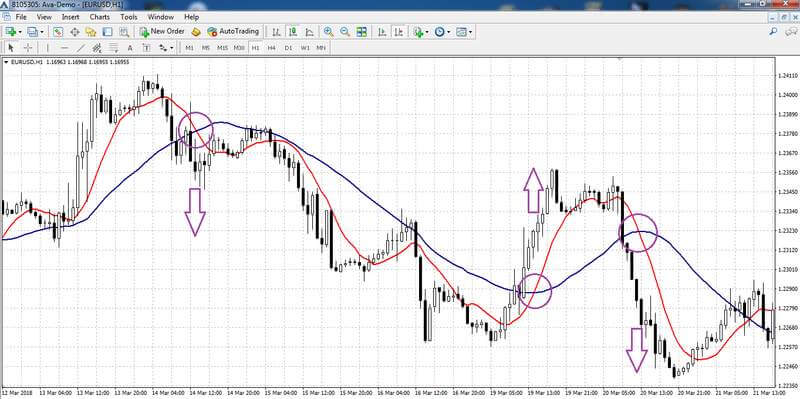
As becomes clear from the example, the second MA allows to filter out many false signals.
Then again, there is another problem which is connected with lagging. It often happens that the two MAs intersect only when half of the trend is already behind.
MACD is an oscillator that uses the data on two MAs and their interactions. Together with MA, it acts as a filter.
The MA+MACD strategy algorithm is as follows:
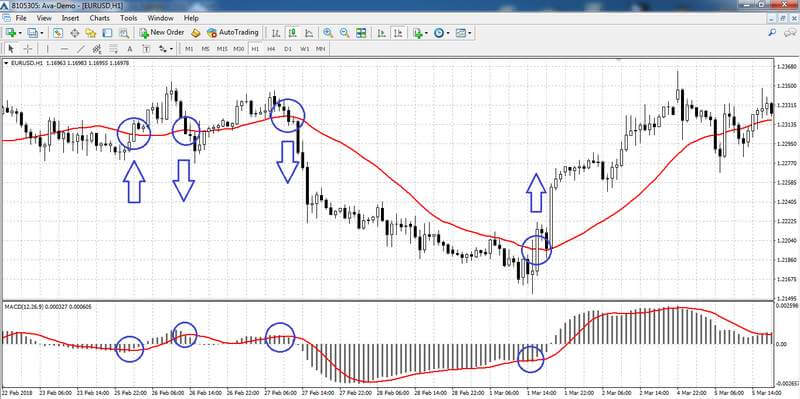
If the signal of one of the indicators is lagging and they are not synchronised, it’s best not to open a position.
Remember, while moving averages are valuable, they are most effective when integrated into a well-rounded trading plan that considers multiple factors.
Because moving averages are the most commonly used indicator in forex trading it’s quite likely that anyone looking to trade forex will use moving averages at some time. But which are the best moving averages to use in forex trading? The depends on whether the trader has a short-term horizon or a long-term horizon. For short-term trades the 5, 10, and 20 period moving averages are best, while longer-term trading makes best use of the 50, 100, and 200 period moving averages.
Moving average crossover strategies have been found to be quite useful, but traders need to choose the proper moving averages for their trading strategy. A simple moving average typically lags price by too much to be useful in trading. Instead an exponential moving average should be used. Even better for moving average trading strategies is the use of the double exponential moving average (DEMA). Because the DEMA puts a far greater emphasis on the most recent prices its changes reflect price movements more rapidly. Many traders like to use a crossover strategy with DEMA tools, where a fast moving average such as the 10 period, crosses a slower moving average such as the 50 period.
The best moving average crossover combination depends on the time horizon of the trader, as well as the market being traded. A short time horizon calls for a moving average crossover strategy that uses shorter moving averages, such as the 5 period and 20 period. A longer time horizon might see a trader using a crossover strategy that combines the 50 period and 200 period moving averages. Using both combinations together can yield the best strategy. The trader uses the long time horizon to determine the longer-term trend, and then only trades in that direction using signals generated by the shorter-term strategy.
Moving Average is a universal indicator that is used for trading chart analysis in all financial markets. The technical analysis specialists use moving averages to trade not only Forex trading pairs; they also use them with CFDs, commodities trading futures and even in bitcoin trading.
Basic MA trading strategies will help you gain experience and master your skills. Apart from that, you will have to learn more about other indicators and try to use them to make your trading more effective. However, the only way to get truly substantial profits is to develop your own strategy based on your trading experience.
The strategies described in this article are available on the AvaTrade’s trading platform.
Trading Indicators • 13 min
Trading Indicators • 13 min

Trading Indicators • 12 min

Trading Indicators • 13 min

Trading Indicators • 8 min

Trading Indicators • 7 min

Trading Indicators • 15 min

Trading Indicators • 14 min
Trading Indicators • 7 min

Trading Indicators • 7 min

Trading Indicators • 8 min

Trading Indicators • 12 min

Trading Indicators • 8 min

Trading Indicators • 11 min

Trading Indicators • 15 min

Trading Indicators • 10 min

Trading Indicators • 8 min

Trading Indicators • 6 min

Trading Indicators • 5 min

Trading Indicators • 6 min