

Elliott Wave Theory
Trading Indicators • 8 min
See a trading opportunity? Open an account now!
Heikin Ashi charts look like typical candlestick charts, but they smooth out price action because their bars are computed out of price ranges rather than every tick movement. The Heikin Ashi technique is designed to filter out market noise and provide a clear picture of the prevailing conditions in the market.
Traders can read price action by watching candlestick types or patterns when using normal candlestick charts. When using the Heikin Ashi technique, traders can accurately determine trends when a valid trend is in the market and when it pauses or is likely to reverse.
The technique can help traders decide whether they should stay in the market or exit the trade. Munehisa Homma introduced Heikin Ashi in the 1700s, the same individual that also created the typical Japanese candlestick charts.
Normal candlesticks include information (open, close, high, and low prices). Heikin Ashi candlesticks also use these values, including information from previous periods.
Here is the formula for calculating Heikin Ashi candles:
Open
The open of a Heikin Ashi candle is the midpoint of the previous candle.
Open = (open of previous candle + close of previous candle)/2
Close
The close of a Heikin Ashi candle is the average price of the current period.
Close = (Open + Close + High + Close)/4
High
The high of a Heikin Ashi candle is the maximum price reached during the current time.
High = Maximum price reached
Low
The low of a Heikin Ashi candle is the minimum price reached during the current time period.
Low = Minimum price reached
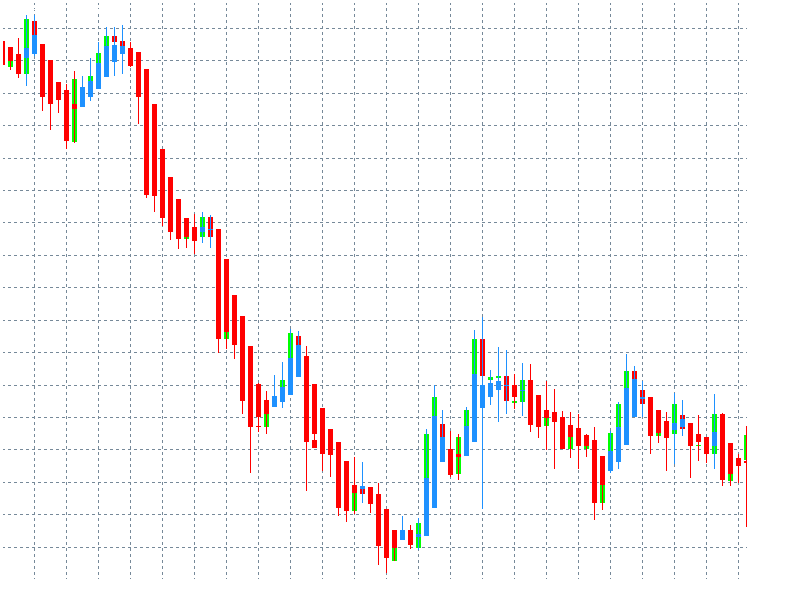
Heikin Ashi helps in smoothing out price action and makes it easy to spot the dominant trend in the market. The computation can further help determine whether a trend is strong or weak.
Candle wicks depict a strong trend. For instance, a series of candles with no lower wicks will represent a solid upward trend. This means that the price did not go below the previous candle’s midpoint at any given time.
Heikin Ashi charts also help traders ride out a trend and maximize profits in a trending market. On a Heikin Ashi chart, bullish and bearish candles alternate less frequently, which can help traders maintain trend bias and prepare adequately for valid reversals.
Nonetheless, Heikin Ashi also has some disadvantages. The chart can give lagging signals because previous data is factored in calculating Heikin Ashi candles. This can be particularly limiting for day traders who want to take advantage of opportunities within a short time. The chart does not display important price information, such as actual closing prices and gaps, which help other traders make critical trading decisions.
Heikin Ashi is usually compared to another type of Japanese chart known as Renko. Both charting techniques help smooth out price action and help traders identify dominant trends quickly. But Renko is computed differently. A Renko chart is made up of ‘brick’ or ‘boxes’ that form after a specified price movement has been achieved, no matter its time. Renko boxes are created at 45-degree angles next to each other, and only closing prices are used to determine their construction.
Renko charts have a time axis, but boxes only form when a movement has been achieved, not after a specified time period. For instance, a daily Renko chart can be set to draw boxes after every 50 pips. A bullish Renko box will only form if the daily closing price has achieved a minimum of 50 pips compared to the previous session’s close. If the price does not move over 50 pips, there will be no box drawn. Renko blocks are not drawn next to each other. If a bullish Renko box has been drawn, the price must move at least 100 pips for a bearish Renko box to be drawn.
Renko charts help smooth out price action and highlight strong support and resistance areas in the market. Nonetheless, they provide very shallow price information because they do not rely on time. They can also deliver false signals when there are price spikes in the market.
When it comes to carrying out a Heikin Ashi strategy, here are the signals that Heikin Ashi delivers:
It is easy to qualify a new trend using Heikin Ashi. This is done when candles change from bearish to bullish, or vice versa. This allows traders to catch a strong trend from its early beginning and ride it all the way.
Candles with no shadows depict a strong trend. A strong uptrend will be depicted by a series of candles with no lowers wicks, whereas candles will depict a strong downtrend with no upper wicks.
Heikin Ashi is great at illustrating when a trend is pausing or about to reverse. Candles with small bodies depict this. When there are candles with small bodies, it is a signal for traders to decide whether they can exit the trend, use a trailing stop, or book partial profits.
See a trading opportunity? Open an account now!
Trading Indicators • 8 min
Trading Indicators • 11 min
Trading Indicators • 13 min

Trading Indicators • 12 min

Trading Indicators • 13 min
Trading Indicators • 8 min

Trading Indicators • 7 min

Trading Indicators • 15 min

Trading Indicators • 14 min
Trading Indicators • 7 min

Trading Indicators • 7 min

Trading Indicators • 8 min
Trading Indicators • 12 min

Trading Indicators • 10 min

Trading Indicators • 13 min

Trading Indicators • 15 min

Trading Indicators • 10 min

Trading Indicators • 8 min

Trading Indicators • 6 min

Trading Indicators • 6 min