Chart Patterns
- Types of Forex Chart Patterns
- Continuation
- Reversal
- Neutral Chart
- How to Use Chart Patterns for Trading
- Disadvantages of Trading with Chart Patterns
- Tips for Trading Effectively
What Are Chart Patterns?
If the forex market is a jungle, then chart patterns are the ultimate trails that lead investors to trading opportunities. When trading financial assets in the forex market, profits (or losses) are made out of price movements. Price changes are usually represented using candlesticks, and after a series of time periods, candlestick patterns form on a chart, telling the price action story of the underlying asset.
Chart patterns are powerful tools for performing technical analysis because they represent raw price action and help traders to feel the mood and sentiment of the market. They essentially allow traders to ride the market wave, and when well understood and interpreted, they can help pick out lucrative trading opportunities with minimal risk exposure.
Trading Chart Patterns
Types of Forex Chart Patterns
Chart patterns are classified according to the signals or directional cues that they provide to traders. Here are the 3 types of chart patterns:
Continuation
Continuation chart patterns form during an on-going trend and they signal that the dominant trend will continue. Continuation patterns usually occur during price consolidation periods and offer great opportunities for traders to open positions in the direction of the dominant trend.
The most common continuation patterns include directional wedges, flags and pennants. These patterns build up in a retracement manner and a breakout in the direction of the main trend confirms that the temporary pullback is now over.
- Directional Wedges
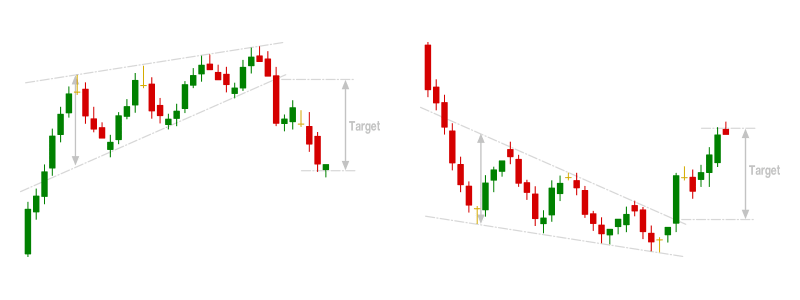
Directional wedges can deliver reversal signals. Falling wedges form at the bottom of a downtrend whereas rising wedges form at the top of an uptrend.
Directional wedges inform about the struggle between bulls and bears when the market is consolidating. For instance, a rising wedge in a downtrend is an indication that buyers are actively pushing the price higher, but they are forming higher lows faster than they are forming higher highs. This is a signal of buyer exhaustion and prices are likely to break lower to resume the downtrend.
- Pennants
Pennants usually signal a small pause in a strong trend. They form in the shape of triangles, but they are very brief, with the resulting move duplicating the movement that preceded the formation of the pennant. In an uptrend, a bullish pennant will form when a small period of consolidation is followed by a strong desire by bulls to drive prices higher. It will be a signal that bulls are charged up for another strong push higher.
- Flags
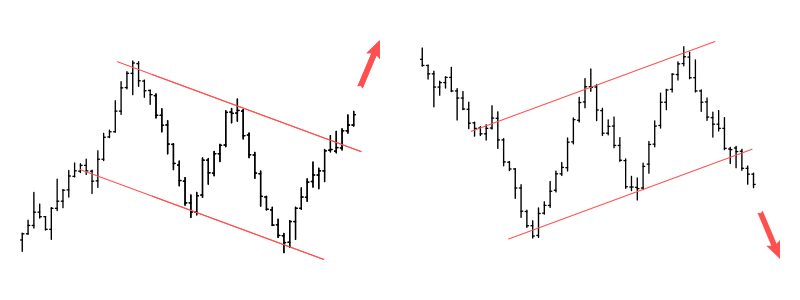
Flags form when prices consolidate after sharp trending moves. The preceding sharp trending move is known as a flagpole. In an uptrend, a flag pattern will form when prices consolidate by forming lower highs and lower lows to signal a period of profit-taking. A break outside the upper falling trendline will be a signal that bulls are ready to drive prices higher for the next phase.
Continuation patterns offer low risk, optimal price entry points for traders to join the direction of the dominant trend.
Reversal
Reversal chart patterns form when a dominant trend is about to change course. The signal that a prevailing trend’s momentum has faded, and the market is about to reverse.
If there is an uptrend, a reversal chart pattern signals that the market is about to turn lower; similarly, a reversal chart pattern in a downtrend signal that the market is about to turn higher.
The most common reversal chart patterns include straight and reverse head and shoulders, double tops and double bottoms, falling and rising wedges, as well as triple tops and triple bottoms. This pattern happen after extended trending periods and signal price exhaustion and loss of momentum.
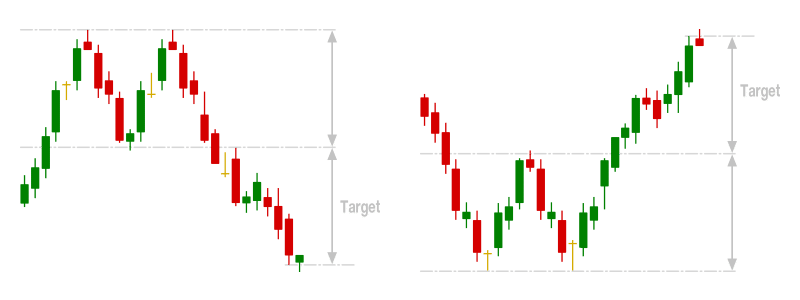
- Head and Shoulders Patterns
A straight head and shoulders pattern forms in an uptrend when the price makes three highs: the first and the third highs are almost similar in height (shoulders), while the second high is higher (head). A neckline is drawn to connect the lowest points of the troughs formed by the formation. The distance between the neckline and the ‘head’ serves as the target price when the price breaks below the neckline. A reverse head and shoulders forms in a downtrend, with the second low being lower than the first and third lows. The target price will be the distance between the neckline and the head when the price breaks above the neckline.
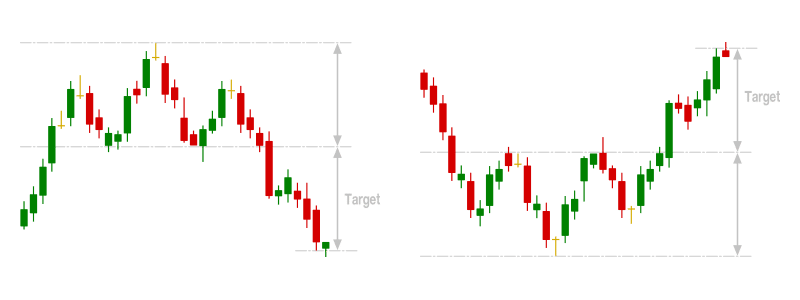
- Double Tops and Double Bottoms
Double tops and double bottoms form after the price makes two peaks or valleys after a strong trending move. They signal price exhaustion and a desire by the market to reverse the current trend. Price targets, when trading double tops and bottoms, are equal to the same height as the formation.
- Triple Tops and Triple Bottoms
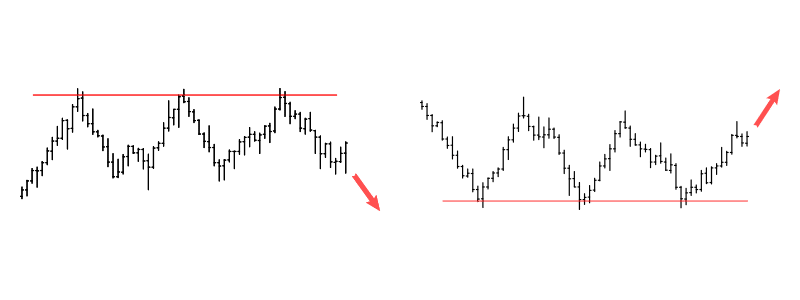
Similarly, triple tops and triple bottoms form after the price makes three peaks or valleys after a strong trending move. They also signal fading momentum of the dominant trend and a desire for the market to change course. The height of the formation also serves as the price target for a reversal when the neckline is breached.
It is important to note that reversal patterns require patience as they usually take a long time to play out. This is mainly because it requires a strong conviction before investors can fully back up the opposite trend.
Neutral
Neutral chart patterns occur in both trending and ranging markets, and they do not give any directional cue. This signal that a big move is about to happen in the market and traders should expect a price breakout in either direction.
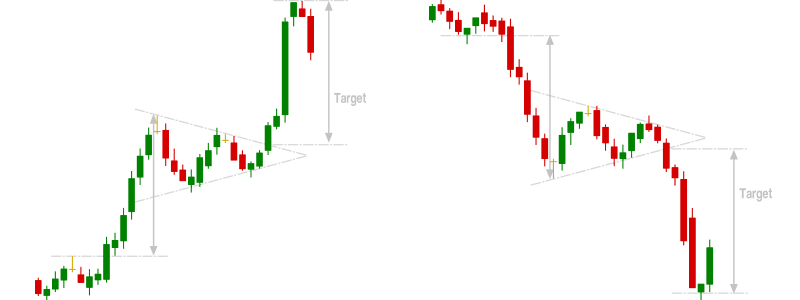
- Symmetrical Triangles
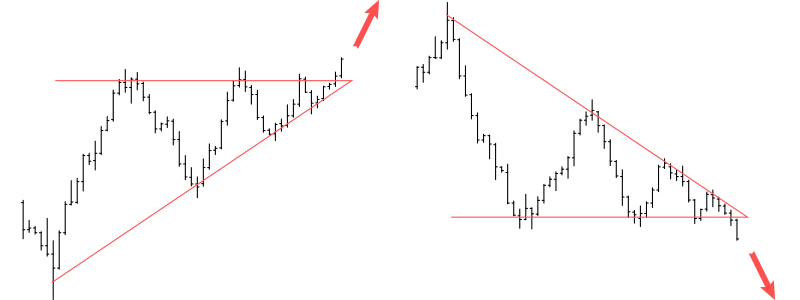
Symmetrical triangles are some of the most common neutral patterns. A symmetrical chart pattern forms when the price forms lower highs and higher lows. The slopes of the highs, as well as that of the lows, converge to form a triangle. The formation illustrates that neither bulls nor bears are able to apply enough pressure to form a definitive trend.
No group has an upper hand, and as the price converges, one of them may have to give in. With prices converging, buyers and sellers are pitted against each other. If buyers win, prices will break out upwards; if sellers win, prices will break out downwards. Traders watch neutral patterns without directional bias and seek to join the momentum of the new trend
How to Use Chart Patterns for Trading
Chart patterns are a graphical representation of the real-time demand and supply in the market. Chart patterns allow traders to enhance their trading activity by enabling the following:
- Evaluating the risk/reward ratio of the forming signal
Chart patterns have a defined formation and expectation of the potential future price behaviour. This means that when a chart pattern forms, the subsequent price action determines whether it is a valid or invalid opportunity to trade or hold a position. There are defined rules for every chart pattern, and this helps in determining the risk/reward ratio beforehand. For instance, when a head and shoulders pattern forms in an uptrend, the initial target for the expected down movement is a pip amount equivalent to the distance between the ‘neckline’ and the top of the ‘head’. A stop-loss can be placed just above the ‘shoulders’. With this information beforehand, traders can evaluate whether any trading opportunity that arises is worth trading.
- Opening positions based on price action
Price action is usually defined as the footprint of money. Price action traders read and interpret raw price action and identify trading opportunities as they occur. While still a form of technical analysis, price action involves the use of clean or ‘naked’ charts; no indicators to clutter the charts. Trading chart patterns is the highest form of price action analysis, and it helps traders to track trends as well as map out definitive support and resistance zones. Unlike numerous technical analysis indicators that are inherently lagging in nature, chart patterns are actually leading and allow traders to time market opportunities effectively and efficiently. This means that traders are able to place buy and sell orders in the market early enough and at optimal price points.
- Setting price targets for conditional orders
Conditional orders are special forex order types that attach special parameters that must be met before they are executed in the market. The most common and basic conditional orders include limit orders, stop orders and stop-limit orders. There are other, more advanced (but less common) conditional orders that include GTC (good till cancelled), GTD (good till date) and OCO (one cancels the other). Conditional orders have defined price targets and they help traders manage risks, open positions, as well as secure profits. As mentioned above, chart patterns are usually rule-based and have specific price targets when they form. This makes them the ideal analysis type for trading conditional orders, where specific price levels are targeted.
- Adapting to changing market conditions
As mentioned, trading with chart patterns means that traders track the raw price action of an asset. Chart patterns make it easy to determine or confirm when market conditions change unexpectedly. Identifying changes in market conditions early can help traders lock in their profits or limit their losses. It can also help traders to enter trade positions consistent with the new trend much earlier. Changes in market conditions are a natural source of market risk, but chart patterns ensure that they are a source of great opportunity.
Disadvantages of Trading with Chart Patterns
Despite the benefits of forex patterns, they are not without their disadvantages (just like any other investing or trading strategy). Here are some of the disadvantages:
- Chart patterns can deliver false signals
Patterns do not work out 100% of the time. This means that what can be considered a valid chart pattern, may play out in a manner that is not expected. It is, therefore, important that traders only take advantage of opportunities whose risk/reward ratios are compelling enough.
- Chart patterns can inspire subjectivity
Chart patterns allow traders to get the ‘feel’ of the market. While this is very important, there is the inherent danger of traders becoming more subjective than objective when seeking to trade chart patterns. There are hundreds of chart patterns, and traders may develop subjective biases when determining what patterns have formed or will form as the price action plays out. Subjective trading is more dangerous because traders become more guided by general guidelines, rather than strict rule-based systems that characterise objective trading. As well, one trader may consider a chart pattern as a continuation pattern, while another trader may consider it as a reversal formation and trade it in a completely different manner.
- Chart patterns can sometimes take a long time to form
Patience is a great virtue for investors, even more so when trading charts. High probability signals generated by chart patterns may take several time periods to be conclusively confirmed. This may be psychologically burdening as traders watch the price action playing out and they may feel as though some profits are being left on the table.
- Most patterns are only effective for the short term
Most patterns provide signals that are only valid for a limited time period. This means that traders only have a small window of opportunity within which to take advantage of the signals generated by chart patterns. A slight delay can mean that a trading signal no longer offers an attractive risk/reward proposition.
Tips for Trading Chart Patterns Effectively
Chart patterns offer an efficient way of tracking price action in the market, to identify lucrative trading opportunities. Here are some tips for making the most out of trading forex chart patterns:
- Switch to Line Charts
Chart patterns can provide quality trading signals, but you have to first be able to find them. This may not be complicated, but because identifying a chart pattern late may lead to less than desired results, it is important to devise a way of determining their formation early enough. This is why traders should switch to line charts when they wish to confirm that a chart pattern is forming. Line charts can help in this regard as they smoothen and simplify the price action and make it easy to confirm a chart pattern early enough for proper trading.
- Confirm Chart Pattern Signals with Candlestick Patterns
Chart patterns are a great price action technique, and the signals they provide can be more qualified by candlestick patterns that also help in analysing the raw price movement of the market. A chart pattern will be more qualified if there is a confluence with candlestick patterns, such as pin bars, Marubozu, spinning tops and Doji. While chart patterns take a longer time to develop, candlestick patterns can require just one or two time periods to form and may help chart pattern traders to pick out high-quality, early entry and exit trade opportunities in the market.
- Combine Chart Patterns with Technical Indicators
Chart patterns do not lag price action; this may be a good thing, but the danger is that early price action signals may be very choppy. Most technical analysis indicators lag price action and when combined with chart pattern analysis, they confirm solid signals which can be aggressively traded by traders in the market. For instance, traders can take aggressive trade positions when the price breaks out of a symmetrical triangle and an indicator, such as the ADX, confirms that there is sufficient momentum to back up the directional move.
- Trading Chart Patterns using Conditional Orders
Timing is an important aspect when it comes to trading chart patterns. This is why conditional orders, such as stop orders and limit orders, provide the best way to take advantage of trading opportunities created by chart patterns. For instance, when the price is consolidating in a bullish flag pattern during an uptrend (a continuation pattern), traders can place buy stop orders that will be filled when there is a breakout in the direction of the trend. This will ensure that traders ride the bull trend as soon as it resumes.
Final Words
Chart patterns provide a reliable way of tracking price changes in the market. They help traders identify prevailing market conditions (existing trends as well as key support and resistance levels). Chart patterns also help in anticipating possible changes in market conditions and provide an objective way of taking advantage of arising trade opportunities. While they provide compelling trade signals, it is important to exercise strict risk management when trading chart patterns because they are not 100% reliable.
Thus, chart pattern trading signals should be traded with definitive price targets and stop-loss orders at all times to limit risk exposure and enhance profit opportunities. It is also prudent to combine chart patterns with other analysis techniques, such as technical indicators and candlestick patterns, to qualify the generated trading signals. This will help alleviate the disadvantages of chart patterns, such as false signals and subjectivity bias.
Overall, the advantages of chart patterns far outweigh their disadvantages. Since numerous chart patterns can form in the market, traders should seek to build and improve upon their trading knowledge and skills so that they can accurately identify and fully exploit the trading opportunities delivered by chart patterns. If well understood, chart patterns have the potential of generating a steady stream of lucrative trading opportunities in any market, at any given time. At AvaTrade, you can use a demo account to learn how to recognise chart patterns, without putting any of your trading capital at risk.
Forex Chart Patterns FAQs
- How do you trade forex patterns?
If you’re going to trade forex patterns the first step is to not only learn what each pattern looks like and how it forms, but to memorize the patterns and learn to recognize them as they are being created on the charts. Once you have that mastered it becomes far easier to trade forex patterns. As you identify a pattern developing you highlight the proper buy point and if the price of the currency pair hits that point you enter your position. You should also have a profit target where you exit the position to collect profits.
- How do you analyze a forex chart?
Learning how to analyze a forex chart is a critical skill for anyone interested in trading forex markets successfully. The process of analyzing the chart begins with choosing the proper time frame. If you want to day trade you’ll choose a shorter time frame, perhaps one hour or less, but for momentum trades a longer time frame such as daily works best. You can also analyze the weekly chart to get a long-term picture of the market. Once you have the proper time frame your analysis is a matter of looking for emerging trends and technical patterns, as well as support and resistance levels.
- How do you identify a trading pattern?
Trading patterns act as a visual representation of past market activity and as indicators of future price movement. Identifying these trading patterns can be quite frustrating for the novice trader, but once they internalize the patterns and get experience in identifying them it becomes far easier. Once it becomes second nature identifying trading patterns becomes a powerful tool. It’s important to realize too that not every pattern plays out as expected. Having an exit plan when a pattern goes wrong is just as important as identifying the trading pattern in the first place.
** Disclaimer – While due research has been undertaken to compile the above content, it remains an informational and educational piece only. None of the content provided constitutes any form of investment advice.


